Graphical user interface (GUI)
The GUI is an easy to use way to use MPL-Data-Cast. The main window consists of a tab for data of each experiment type, like, e. g. RT-DC.
Main window
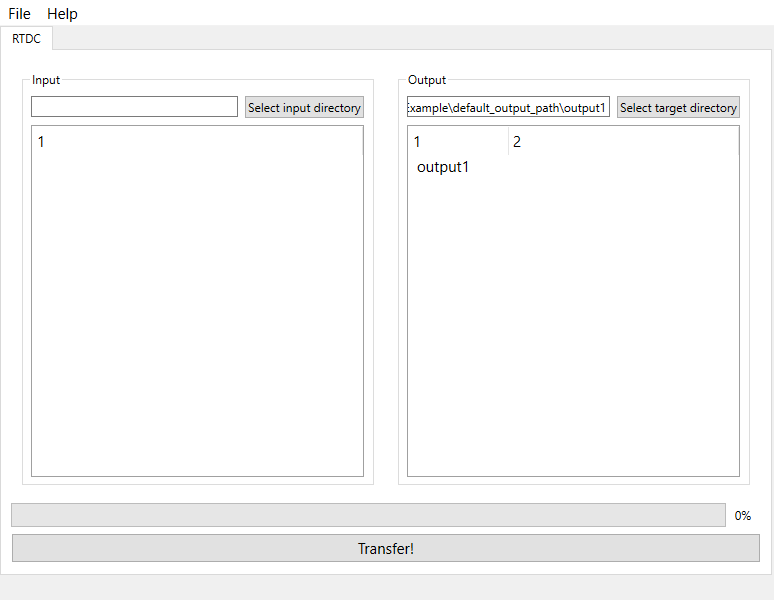
On the left, you can specifiy the input directory, either by dragging-and-dropping a folder or by using the button “Select input directory”. You can also drag-and-drop a file, in that case, the parent directory of that file will be used. On the right, the output directory is shown, it can be changed in the same way as the input directory.
For convenience, the default output directory can be changed in the settings.
The two big white areas will show the contents of input and output directory respectively. Since large directories with many subdirectories can cause performance issues, one can change the maximum depth of directories that should be displayed here. The minimum is 1 and the maximum is 24.
The button at the bottom of the window starts the transfer of data using the RT-DC recipe. The progress bar indicates the current status of the file transfer and is updated after each file that was processed.
Preferences
In the top, there is current default output directory shown. It can be changed via the button “Select directory”.
Below that, the maximum depth of subdirectories that will be shown in the main window can be set. The minimum is 1, so that at least the direct contents of input and output directories are shown. The maximum is 24.
Warning
Using a large depth limit for displaying sub-directories can cause performance issues, especially if the directories contain a lot of files.